Ethereum price dip extends, liquidates $10 million in long positions as exchange outflows skyrocket. The price of Ethereum has increased its losses by 2% while unwinding long positions worth up to $10.06 million.
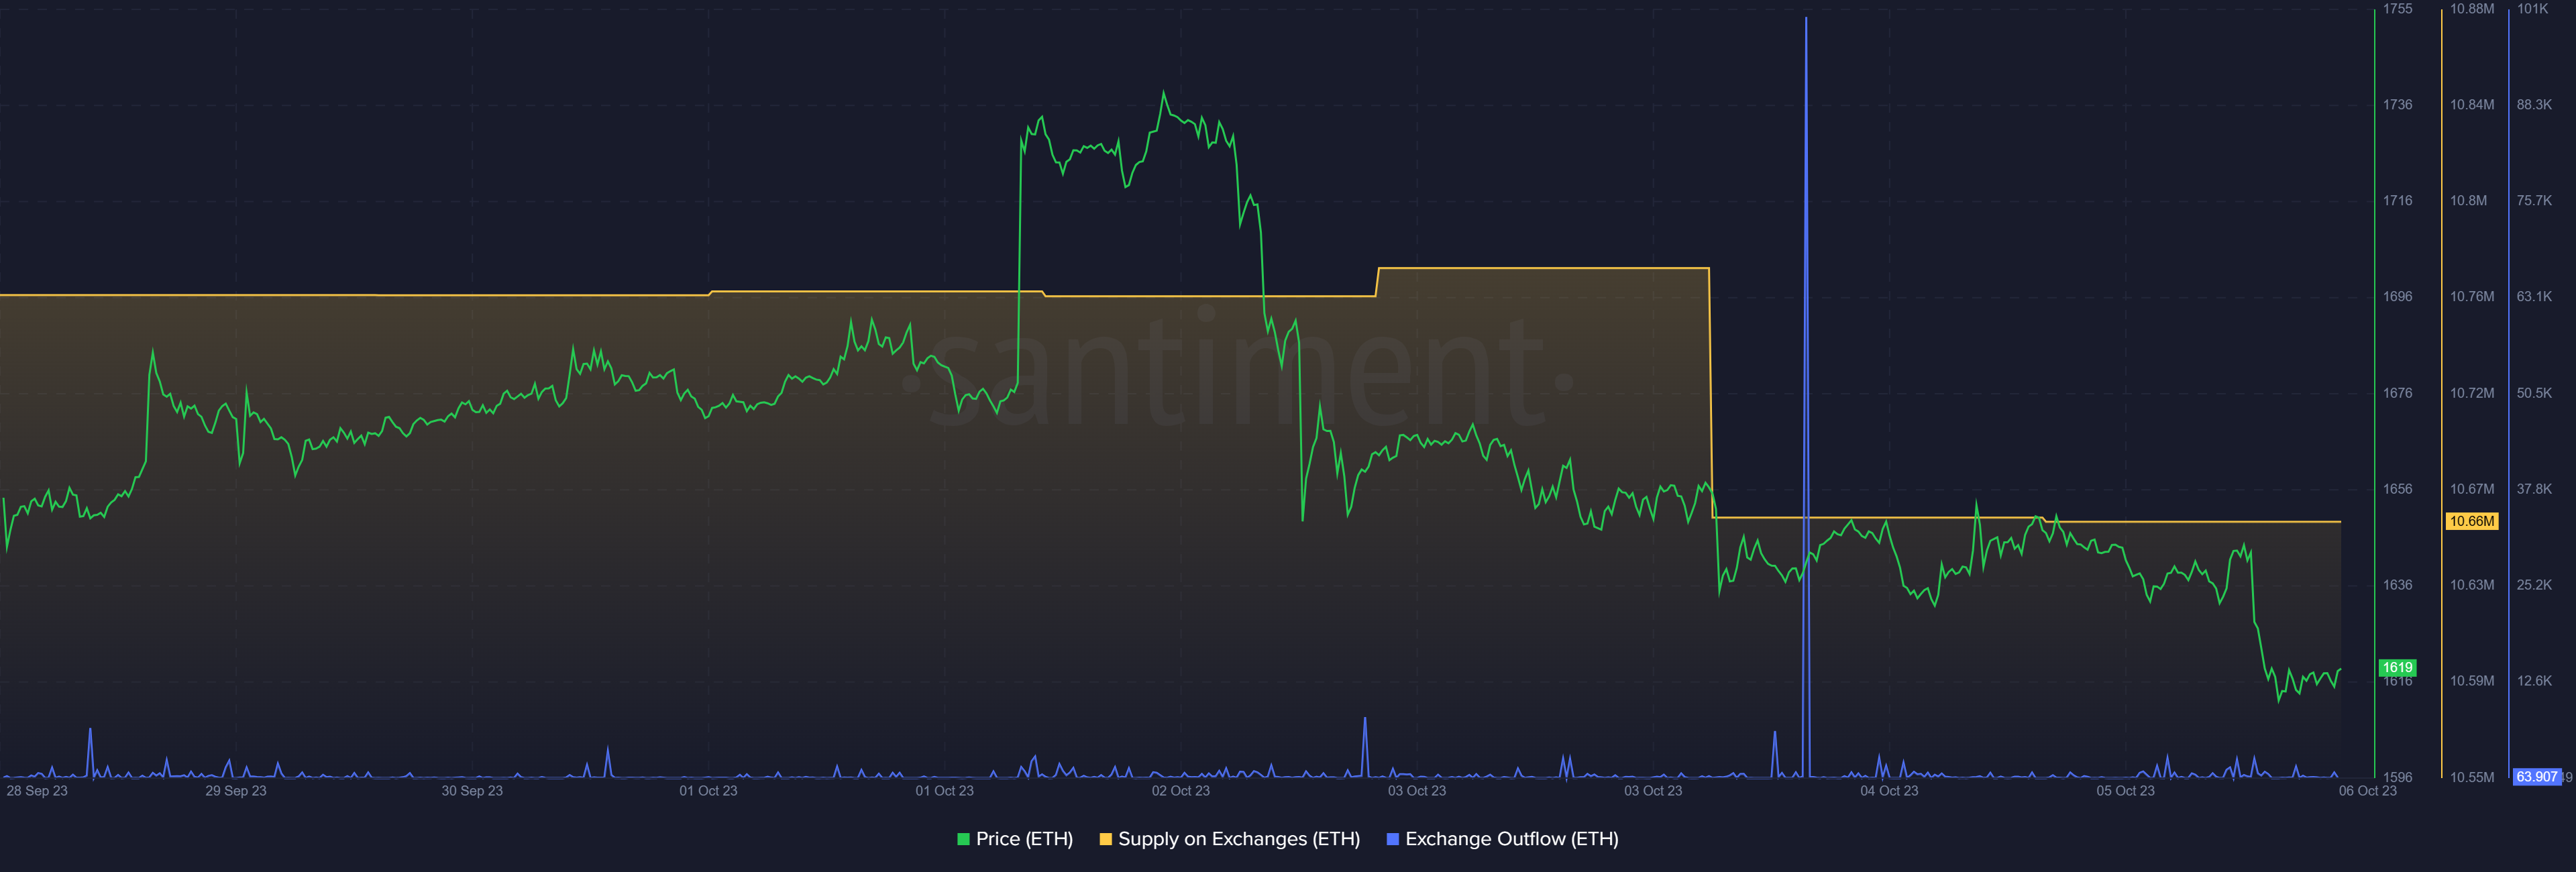
According to Santiment data, ETH on exchanges has decreased from 10.77 million to 10.66 million in just 24 hours.
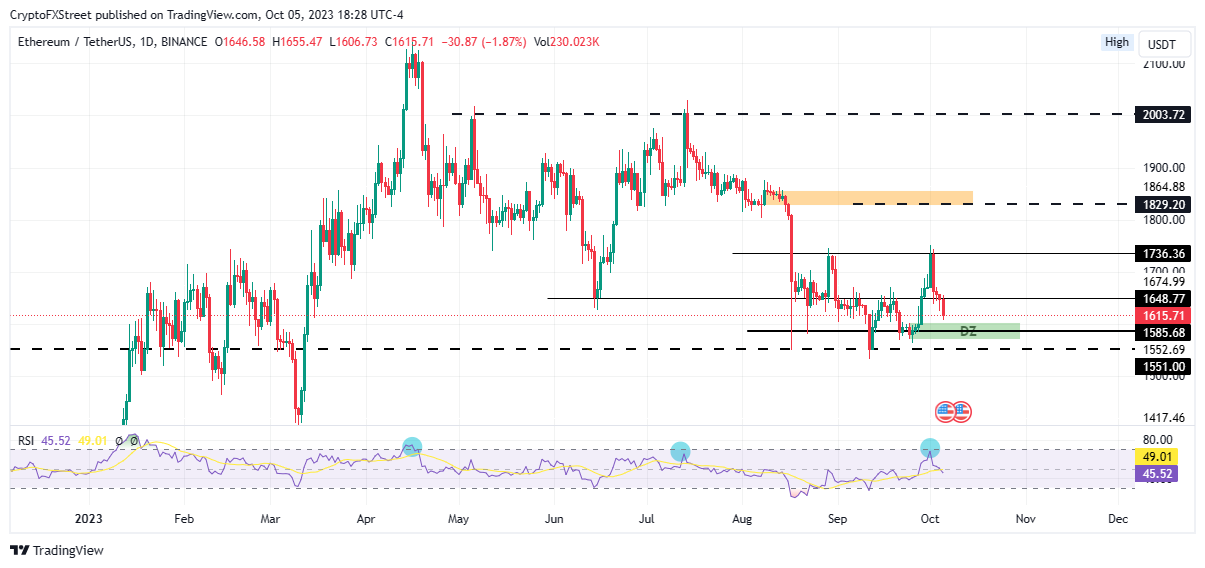
Short-term doom for holders would result from a break and closing below $1,585. Which would likely cause losses to increase to mid-August lows of $1,551.
On-chain data indicates that profit takers act without constraint as the price of Ethereum (ETH) loses all the ground gained during the late-September run and forms a dome-shaped pattern for the fourth straight day.
Ethereum profit booking continues.
Almost 2% of long Ethereum (ETH) positions have been liquidated in the last 24 hours due to the price decline, which may seem insignificant.

ETH liquidations
Open Interest and volume have decreased from the previous reading of $5.28 billion on August 5 of $6.07 billion. The overall number of long and short positions and the asset’s trading volume increased by 15% during the past two months.

ETH Open Interest
This suggests that a sizeable amount of money is leaving the ETH market and that the recent movement in the price of Ethereum is resulting in fewer new contracts being traded.
Open Interest, funding rate FAQs
How does Open Interest affect cryptocurrency prices?
Higher liquidity and fresh capital entering the market are related to higher open Interest. This is viewed as equivalent to improving efficiency, and the pattern is still present. When Open Interest declines, it is viewed as an indication of market liquidation; investors are withdrawing, and demand for an asset is declining, fostering a negative mood among investors.
How does the Funding rate affect cryptocurrency prices?
Funding costs raise the risks associated with liquidation for traders, bridging the gap between spot prices and prices of futures contracts for an asset. A continually high and positive funding rate suggests market participants are bullish and anticipate a price increase. A persistently negative financing rate for an asset implies a pessimistic mood. This suggests traders anticipate a decline in the coin’s price and believe the adverse trend will soon reverse.
Behavior analytics, Sentiment data
This trend is supported by data from the behavior analytics platform Santiment, which shows that the amount of ETH available on exchanges has decreased by about 110,000 ETH in the past day, from 10.77M to 10.66M. This amounts to nearly $177.87 million at the current exchange rate.

ETH Supply on exchanges
Does the price impact indicate a rising market?
Ethereum’s price is $1,615 at the time of writing, mirroring the surge from September 28 to October 1 in terms of price movement. A break below the demand zone at $1,585 and the Relative Strength Index (RSI)’s position below the midline support the idea of a prolonged downward trend, at least in the short term.

ETH/USDT 1-day chart
On the other hand, if the demand zone between $1,603 and $1,569 remains a support floor. Ethereum price may pivot around it to pull back north. Reclaiming the $1,648 barrier back to a support floor. The increases could cause ETH to surpass the equal highs at $1,736 in a very optimistic scenario.
Study reveals that the market may rise when price, volume, and open Interest are declining. Traders with long positions may become disheartened and liquidate their positions due to falling prices, volume, and open Interest. This trend is bearish as long as it persists. The liquidation will end until open Interest reaches a low level. And prices may then be in a position to rise once again.


